- Home
- Genomes
- Genome Browser
- Tools
- Mirrors
- Downloads
- My Data
- Projects
- Help
- About Us
Configuring hic tracks
Genome Browser hic tracks display heatmaps of chromatin folding data and may be configured in several ways to highlight different aspects of the data. By default, hic tracks will use auto-scale options for resolution and score coloring.
The following section describes configuration settings available to hic tracks. For more information on setting up and uploading hic data, click the link on hic custom track creation.
Configuring the display mode
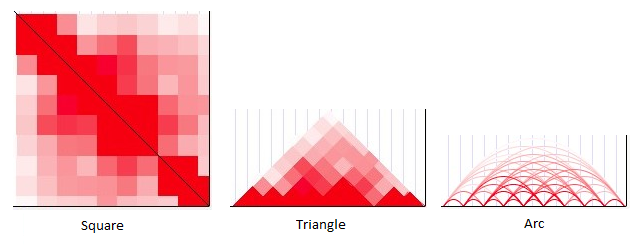
There are three display methods available for Hi-C heatmaps: square, triangle, and arc.

Square mode provides a traditional Hi-C display in which chromosome positions are mapped along the top-left-to-bottom-right diagonal. Interaction values are plotted symetrically on both sides of that diagonal to form a square. The upper-left corner of the square corresponds to the left-most position of the window in view, while the bottom-right corner corresponds to the right-most position of the window.
The color shade at any point within the square shows the proximity score for two genomic regions: the region where a vertical line drawn from that point intersects with the diagonal, and the region where a horizontal line from that point intersects with the diagonal. A point directly on the diagonal shows the score for how proximal a region is to itself (scores on the diagonal are usually quite high unless no data are available). A point at the extreme bottom left of the square shows the score for how proximal the left-most position within the window is to the right-most position within the window.
In triangle mode, the display is quite similar to square except that only the top half of the square is drawn (eliminating the redundancy), and the image is rotated so that the diagonal of the square now lies on the horizontal axis. This display consumes less vertical space in the image, although it may be more difficult to ascertain exactly which positions correspond to a point within the triangle.
In arc mode, simple arcs are drawn between the centers of interacting regions. The color of each arc corresponds to the proximity score. Self-interactions are not displayed.
Score normalization settings
Score values for this type of display correspond to how close two genomic regions are in 3D space. A high score indicates more links were formed between them in the experiment, which suggests that the regions are near to each other. A low score suggests that the regions are farther apart. High scores are displayed with a more intense color value; low scores are displayed in paler shades.
There are four score values available in this display: NONE, VC, VC_SQRT, and KR. NONE provides raw, un-normalized counts for the number of interactions between regions. VC, or Vanilla Coverage, normalization (Lieberman-Aiden et al., 2009) and the VC_SQRT variant normalize these count values based on the overall count values for each of the two interacting regions. Knight-Ruiz, or KR, matrix balancing (Knight and Ruiz, 2013) provides an alternative normalization method where the row and column sums of the contact matrix equal 1.
Color intensity in the heatmap goes up to indicate higher scores, but eventually saturates at a maximum beyond which all scores share the same color intensity. The value of this maximum score for saturation can be set manually by un-checking the "Auto-scale" box. When the "Auto-scale" box is checked, it automatically sets the saturation maximum to be double (2x) the median score in the current display window.
Resolution settings
The resolution for each track is measured in base pairs and represents the size of the bins into which proximity data are gathered. The list of available resolutions ranges from 1kb to 10Mb. There is also an "Auto" setting, which attempts to use the coarsest resolution that still displays at least 500 bins in the current window.
When you have finished making your configuration changes, click the button to return to the annotation track display page.
References
Knight P, Ruiz D. A fast algorithm for matrix balancing. IMA J Numer Anal. 2013 Jul;33(3):1029-1047.
Lieberman-Aiden E, van Berkum NL, Williams L, Imakaev M, Ragoczy T, Telling A, Amit I, Lajoie BR, Sabo PJ, Dorschner MO et al. Comprehensive mapping of long-range interactions reveals folding principles of the human genome. Science. 2009 Oct 9;326(5950):289-93. PMID: 19815776; PMC: PMC2858594